Unless all your project's activities are on a critical path, your network diagram doesn't specify your exact schedule. Rather, it provides information for you to consider when you develop your schedule. After you select your actual dates, you can present your schedule in several formats or combinations of formats. Each format can be effective in particular situations.
Eight formats for a project schedule.
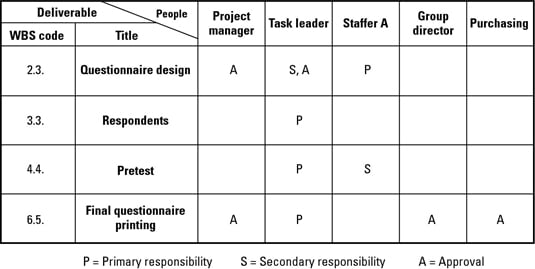
The responsibility assignment matrix (RAM), shown here, displays team roles and responsibilities.
Milestone list: A table that lists milestones and the dates you plan to reach them.
Activity list: A table that lists activities and the dates you plan to start and end them.
Combined activity and milestone report: A table that includes milestone and activity dates.
Gantt (or bar) chart: A timeline that illustrates when each activity starts, how long it continues, and when it ends. The Gantt chart provides a clearer picture of the relative lengths of activities and times when they overlap. The Gantt chart provides a better high-level overview of a project.
Interface Gantt chart: The Interface Gantt chart has all the benefits of the plain Gantt chart plus it illustrates the order in which the activities are performed.
Combined milestone and Gantt chart: A timeline that illustrates when activities start, how long they continue, when they end, and when selected milestones are achieved.
Work breakdown structure (WBS): A diagram that shows an entire project, represented as a Level 1 component that can be subdivided into Level 2 components. Some or all Level 2 components can be subdivided into Level 3 components, and so on.
Combined activity and milestone report.
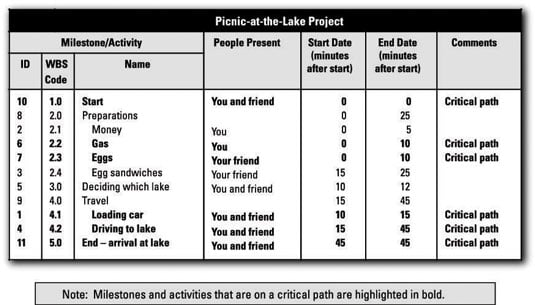
Here’s a 45-minute schedule for a picnic at the lake in a combined activity and milestone report. Milestone lists and activity lists are more effective for indicating specific dates.
Combined WBS, Responsibility Assignment Matrix, and Gantt chart
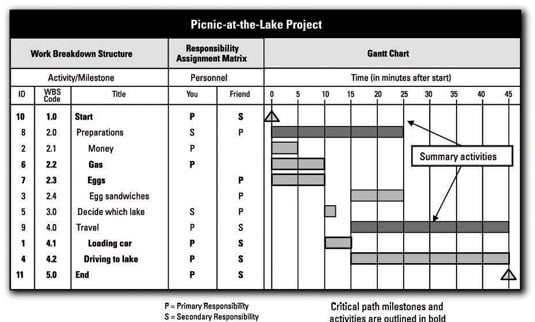
You may combine two or more formats into a single display. Have a look at the combined WBS, Responsibility Assignment Matrix, and Gantt chart (in which triangles represent milestones) for the picnic-at-the-lake example.
In addition to requiring less paperwork to prepare and being easier to update and maintain than separate information documents, a combined display can provide greater insight into the plan by presenting two or more aspects together for ready comparison.
Interface Gantt chart
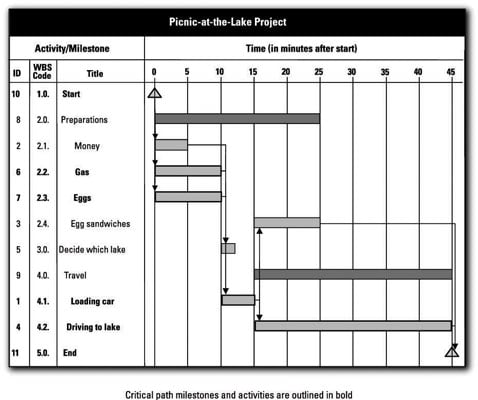
You may also choose to display your project schedule with an Interface Gantt chart. In addition to including all of the information you find in a simple Gantt chart, the Interface Gantt chart represents dependencies between the project’s activities and milestones with arrows drawn between the bars.