
Outliers
Outliers are data points that sit outside of the normal range that you may expect to see when looking at a particular performance indicator, such as engagement. For example, if you generally expect to see 10 clicks on a link and a specific post receives 50 clicks, then that data point would be an outlier as it falls far outside the range that you normally see with regards to clicks and engagement. Outliers are perhaps the most valuable indicator of importance within your data sets. You can see a graphical representation of this phenomenon here.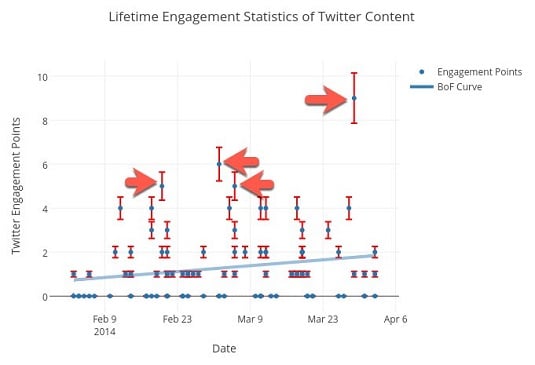
When extracting raw data, running a simple linear regression and analyzing your data for outliers, generally within a 5 to 10 percent margin of error, will give you some great insights into what is working and what is not. A linear regression is a statistical analysis whereby a curve, expressed in this case by the formula y=ax+b is calculated and placed to fit over a given data set. This straight line is the closest representation of a linear progression through the data, and the proximity of your data point to this line — or curve — indicates how well a particular point fits the average. The points that fall far outside this curve are your outliers.
You can find the steps for running a linear regression using a source like Statistics Solutions. You can also use a free tool like Plotly. The data used for these kinds of analyses can range from engagement metrics to conversions to clicks. You can analyze virtually any isolated data set using this extremely powerful method.
Peaks and valleys
As with outliers, you’re looking for anomalies (things that are unusual) in your data when identifying peaks and valleys (highs and lows) within a given set.Run through highs and lows with specific performance indicators, such as traffic from a particular social network, and determine what commonalities exist at each high point and each low point. You can compare periods of analysis, for example, a week or a month. Take what you’ve found and integrate those findings in your everyday strategy.
For example, if you see on the first of every month that an unusually high amount of traffic comes from Facebook, and upon further analysis, you see that on the first you tend to share a particularly inspiring quote accompanied by a link to a landing page, use those findings to expand on this strategy and use it more frequently. Repeat this process for all your identified peaks and valleys, where it is applicable.
Correlations
When analyzing data of a particular type (whether it’s audience data or post-level data), you want to pay close attention to any correlations, either positive or negative, that exist.Your Facebook Page’s post-level data are the insights gathered and exported about your individual posts, rather than general data about your Page and audience. The value in analyzing post-level data is that it aggregates insights about the most valuable kinds of engagement, such as clicks to your website or shares on Facebook. It provides you with the necessary information to build a robust content strategy.
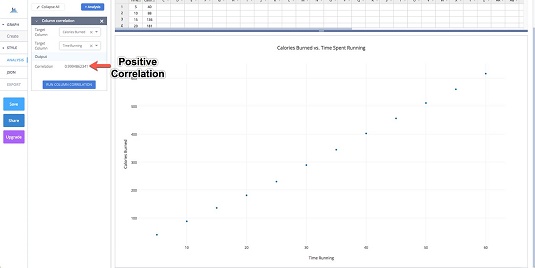
While it is not absolutely necessary to run a Pearson product-moment correlation test, which is an advanced statistical analysis to measure the mutual dependence of two variables, and while it may not be possible based on the available data, it certainly helps. In cases where it’s not possible, you’ll want to simply review your data in order to identify whether similarities arise in a particular cluster. Here’s a positive correlation.
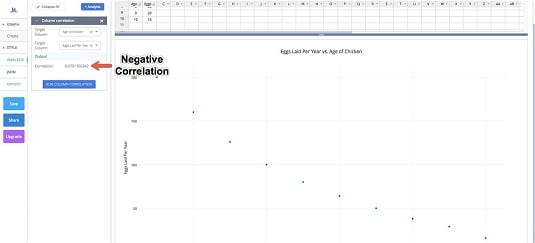
Now, you see a negative correlation.
This is what no correlation looks like.
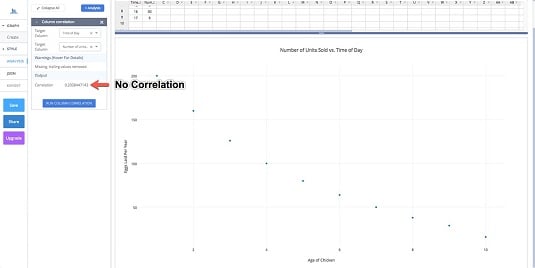
For example, if you analyze high-performing posts shared on Facebook, ask yourself whether these posts share similarities such as the time they were posted, an abundance of a certain color, or length. You can then use these indicators to develop new content that will ensure a significantly higher engagement rate.
Industry trends
Using an industry monitoring technology has several benefits. One of the greatest is undoubtedly the ability to spot conversational trends within your industry before the competition does.When using an industry monitoring tool, pay close attention to upward-trending conversation topics within your audience segments. Identifying these trends can be extremely beneficial when developing your next campaign or creating new, relevant content.
Waste
When you want to optimize your budget and improve operational efficiency, waste is a powerful indicator. In this case, waste refers to ad spends put toward ads that yield little to no results. You know you have waste if you find these two primary indicators:- A higher than average number of touchpoints in a particular sales cycle, which may indicate inefficiencies with the cycle flow.
- A significantly greater cost-per-conversion or cost-per-action, which may indicate flaws or discrepancies between the product and the Millennial audience you’ve targeted.
Essentially, as with outliers, you want to take the time to analyze certain outstanding data points. Determine whether they’re indicative of some form of budgetary or time waste. Then make the necessary adjustments in order to optimize your processes.